This is an exciting time for thermal remote sensing. There are various sensors in space, and new ones being build. They differ with wavelengths, spatial resolution, and revisit time.
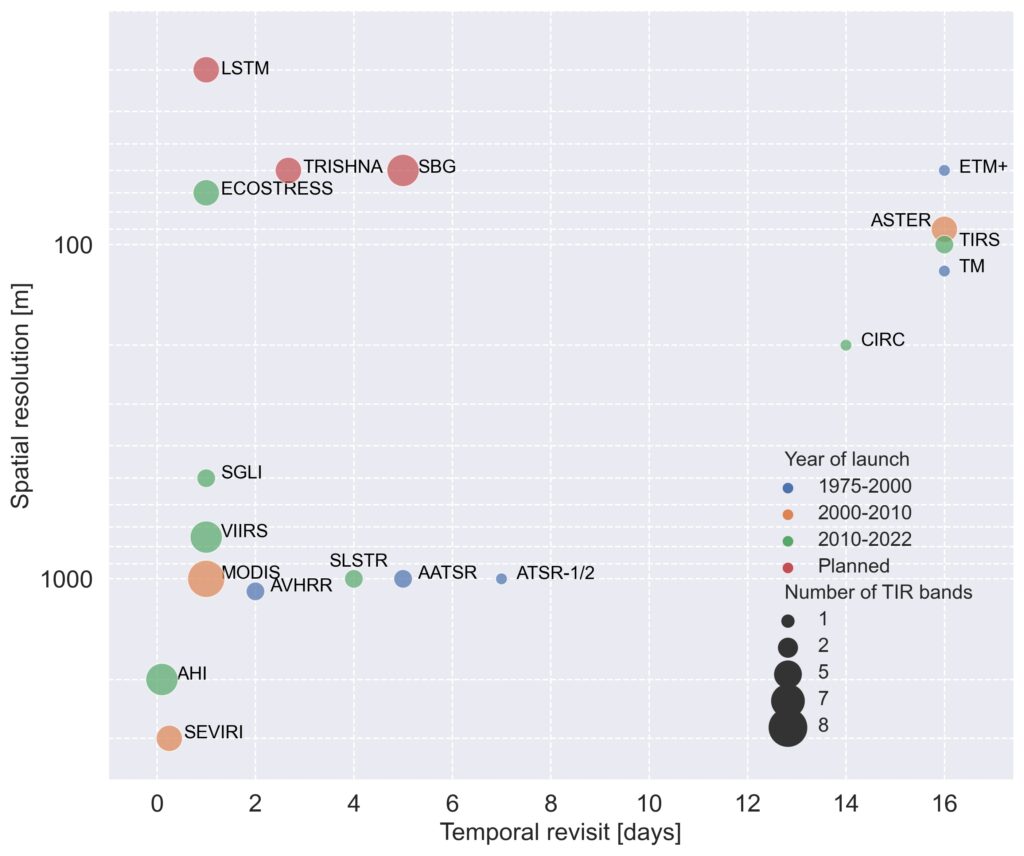
Jennifer Susan Adams (University of Zurich) created a graph with a great overview of the available sensors, where three distinct groups can be seen: (1) low resolution and high revisit, (2) high resolution, but low revisit, and (3) high resolution and high revisit (mainly new coming missions).

When you use the figure in your materials, please cite:
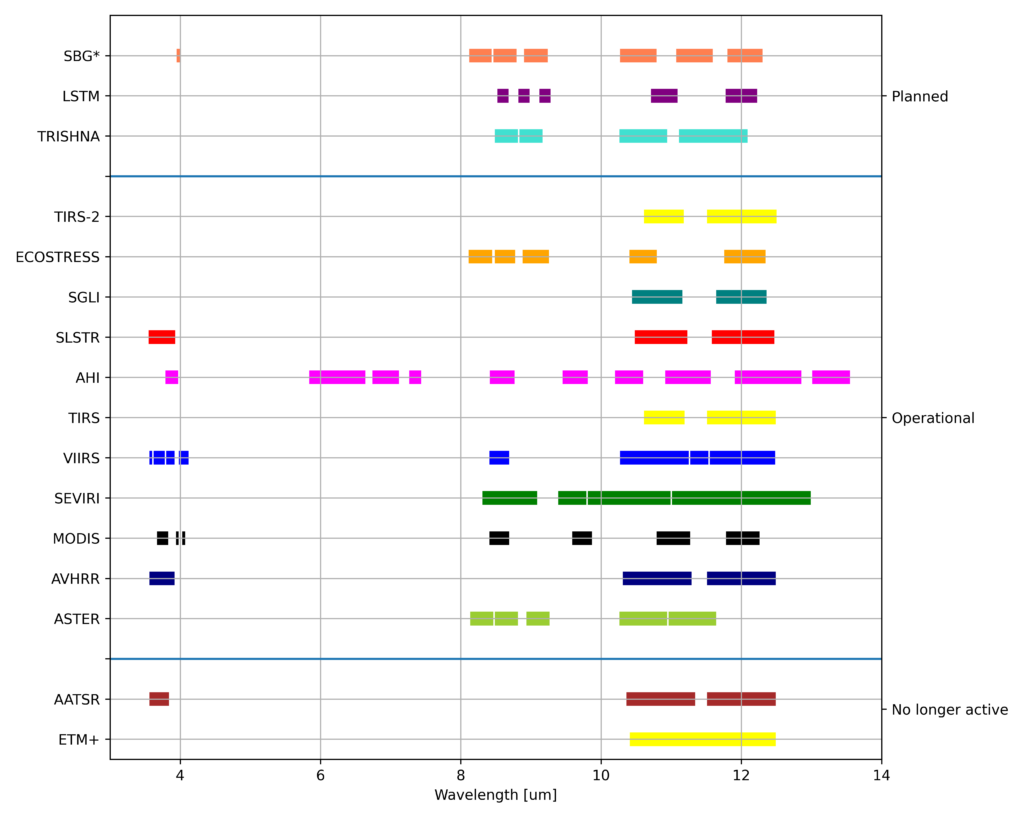
Agnieszka Soszynska prepared an overview on the wavelengths of the sensors:

* Note that SBG bands are not fixed, the information provided here is based on HyspIRI bands that should resemble SBG bands
When you use the figure in your materials, please cite:
| Sensor | Launched | Spatial resolution of the products | Still active? | Available satellites |
| AVHRR | 1978 | 1100 | yes | TIROS-N and NOAA-6 to NOAA-19, MetOp-A/B/C |
| ETM+ | 1999 | 60 | no | Landsat-7 |
| MODIS | 1999 | 1000 | yes | Aqua, Terra |
| ASTER | 1999 | 90 | yes | Terra |
| AATSR | 2002 | 1000 | no | Envisat |
| SEVIRI | 2004 | 6000 | yes | Meteosat-11, Meteosat-10, Meteosat-9 |
| VIIRS | 2011 | 500, 1000 | yes | Suomi NPP, JPSS |
| TIRS | 2013 | 100 | yes | Landsat-8 |
| AHI | 2015 | 2000 | yes | Himawari-8, Himawari-9 |
| SLSTR | 2016 | 1000 | yes | Sentinel-3A and Sentinel3B |
| SGLI | 2017 | 500 | yes | GCOM-W, GCOM-C1 |
| ECOSTRESS | 2018 | 70 | yes | ISS |
| TIRS-2 | 2021 | 100 | yes | Landsat-9 |

