by Abigail Marie Waring (PhD Candidate)
University of Leicester (UoL)/ National Centre for Earth Observation (NCEO),
Department of Earth Observation Science, School of Physics & Astronomy, Surface Temperature Research Group
“We are the first generation to feel the effect of climate change and the last generation who can do something about it.”
– Barack Obama, Former U.S. President
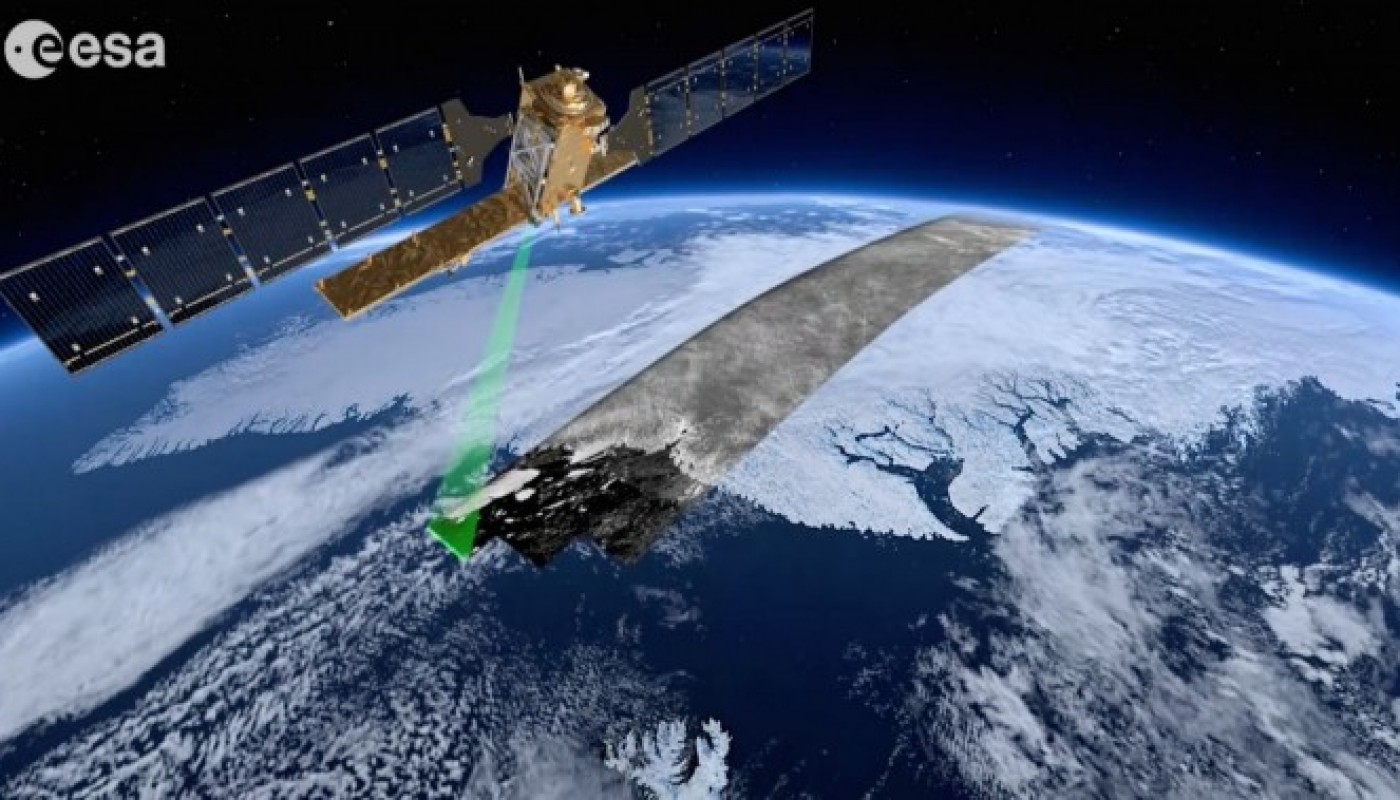
ESA’s Sentinel-1 Satellite [1]
Table of Contents
- Unveiling Frozen Environment
—> Article overview - Principles in Thermal Remote Sensing
—> How we use satellites in Space to monitor Earth - Significance of Ice and Snow Analysis from Space
—> Types of ice and snow on Earth and their role - How is the cryosphere changing?
—> What we currently know - Thermal Signatures of Ice and Snow
—> Recognising ice and snow data and patterns - Data Availability
—> Key satellite sensors and datasets - Current Impact and Future Direction
—> What this means for Earth and our future
Unveiling Frozen Environments
As Earth’s icy domains transform under the weight of natural and anthropogenic climate shifts, scientists have turned their gaze skyward, leveraging the power of thermal remote sensing. This innovative technology provides a panoramic window into the world of ice and snow, unraveling vital insights into our planet’s cryospheric changes.
The Intergovernmental Panel on Climate Chance (IPCC) 6th Assessment (2023)[2] reported widespread and rapid changes in the atmosphere, ocean and cryosphere. That human-induced climate change is already affecting many weather and climate extremes in every region across the globe. It is well known that regions covered in ice and snow such as Greenland and Antarctica, are some of the most susceptible to climate change, and have already undergone severe damages and continue to suffer irreversible losses. Now more than ever is it important to mitigate potentially devastating impacts to the cryosphere and our planet. Thermal satellite remote sensing is one way of monitoring and analysing ice and snow on Earth, and its crucial role on global climate regulation.
This article looks to explore a general overview of the methods, data resources, and the pivotal role of thermal remote sensing in decoding the hidden narratives of our evolving frozen landscapes. This is in aid of encouraging coherence and collaboration of information, that will can bring together both scientific and data user communities.
Video: A tour of the cryosphere through observations collected from a variety of satellite-based sensors. The animation starts in Antarctica, displaying ice thickness between 2.7 and 4.8 kilometres, accompanied by bands of polar stratospheric clouds. As it takes viewers on a journey through this icy continent, the animation highlights distinctive features of the Antarctic landscape that are unique to this region. It showcases ice shelves, ice streams, glaciers, and the creation of enormous icebergs.[3]
Principles of Thermal Remote Sensing
Remote sensing involves utilising instruments to measure properties of objects or features on Earth’s surface, allowing scientists to gather data regarding ice and snow. Thermal remote sensing leverages the electromagnetic spectrum, particularly the infrared portion, to capture emitted radiation from Earth’s surfaces. It operates on principles grounded in physics, particularly in the concept of blackbody radiation[4]. Objects emit heat energy in the form of thermal radiation, characterised by varying intensities and wavelengths contingent upon the surface materials’ temperature and physical attributes[5].
Advanced sensors integrated into orbiting satellites, exemplified by NASA’s Terra MODIS ( Moderate Resolution Imaging Spectroradiometer) in Figure 1, are tailored to detect and quantify this emitted infrared radiation. These sensors are meticulously calibrated to capture precise wavelengths corresponding to the thermal energy emitted, enabling intricate analysis of surface temperatures and thermal properties.
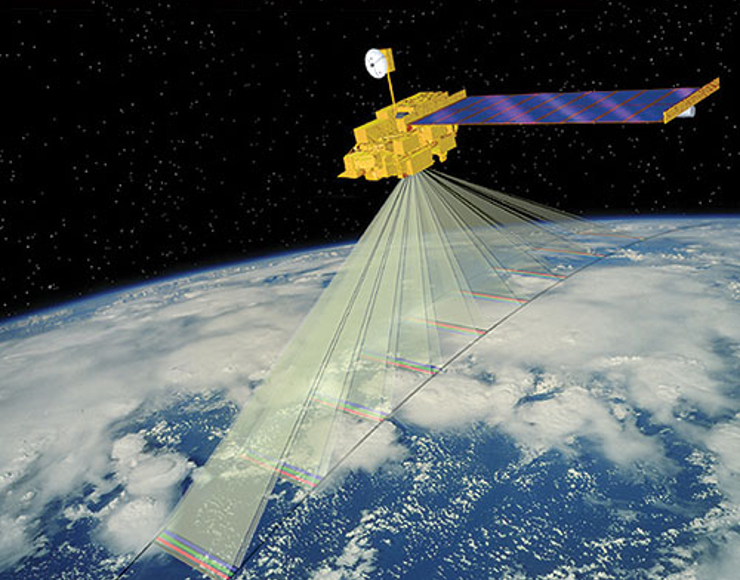
Figure 1: Terra MODIS offers views of Earth’s changing lands in unprecedented detail. Combining high resolution and novel multi-spectral capabilities, Terra MODIS and Aqua MODIS are viewing the entire Earth’s surface every 1 to 2 days, acquiring data in 36 spectral bands, or groups of wavelengths[6]
Remote sensing techniques can be used to analyse surface, near-surface and deep, subsurface regions of ice and snow features. By understanding the blackbody radiation principles and how ice and snow behave in emitting and absorbing energy, remote sensing tools can detect temperature variations, monitor changes in ice and snow cover, and provide insights into environmental changes. It holds immense significance for understanding and monitoring ice and snow due to its ability to capture crucial thermal signatures emitted by these frozen surfaces.
Significance of Ice and Snow Analysis from Space
Ice and Snow on Earth
Landscapes on Earth covered in ice and snow are collectively known as the cryosphere (Figure 2), a word derived from the Greek krios meaning ’cold’[7] . The polar regions, encompassing the Arctic and Antarctic, mark the extremities of the cryosphere, yet its reach extends across vast expanses in between these regions. The constituents of which include snow cover, sea ice, freshwater ice (such as frozen lakes and rivers), large land ice masses (such as glaciers, ice sheets and ice shelves), and permafrost (permanent sub–surface ice). Ice and snow cover significant portions of the Earth’s surface, playing crucial roles in various natural systems and human activities. The advancement of remote sensing technology and techniques are imperative for ice and snow analysis from Space, which offers unparalleled advantages to furthering our understanding. It provides a wide–ranging view of the cryosphere’s changes, allowing for continuous observation of ice sheets, glaciers, and snow cover on regional and global scales for which we would be unable to view from the ground.
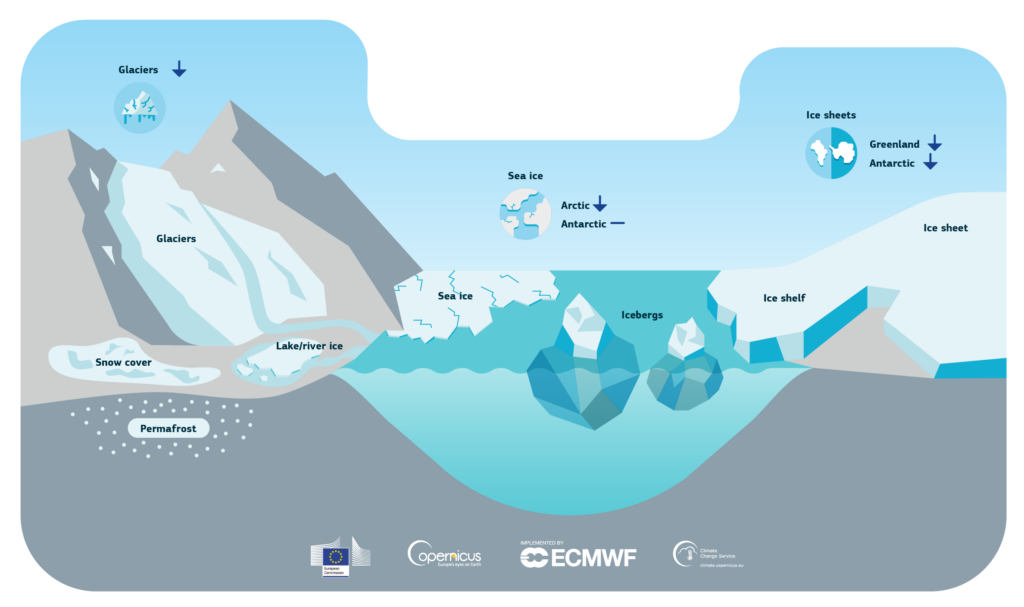
Figure 2: Illustration of significant radiative and non–radiative mechanisms in polar regions, encompassing interactions among the atmosphere, ocean, sea ice, and ice sheets that contribute to the surface energy balance[8].
Surface Energy Balance
The surface energy balance refers specifically to the equilibrium achieved between all energy inputs and outputs at the surface within a defined period. In polar regions and across the cryosphere, maintaining a balanced surface energy is vital within the intricate climate system. These areas endure extreme conditions characterised by extensive snow and ice coverage. The interaction of numerous factors shown in Figure 3 heavily influence the surface energy equilibrium within regions of ice and snow. Solar radiation, subject to seasonal fluctuations and surface reflectivity (albedo), holds significant influences. The high albedo of snow and ice reflects much of the incoming solar radiation, impacting surface temperatures and energy absorption. Conversely, darker surfaces like open water or bare ground absorb solar radiation, leading to localised heating and thawing. Moreover, heat transfer through conduction, convection, and latent heat exchange, alongside thermal radiation emissions, further shape the surface energy balance. The complex interplay among these elements dictates temperature patterns, melt rates, and overall cryospheric stability. Understanding and managing the surface energy balance in polar and cryospheric regions are pivotal for projecting climate trends, evaluating environmental shifts, and effectively managing water resources amidst a rapidly evolving global landscape.
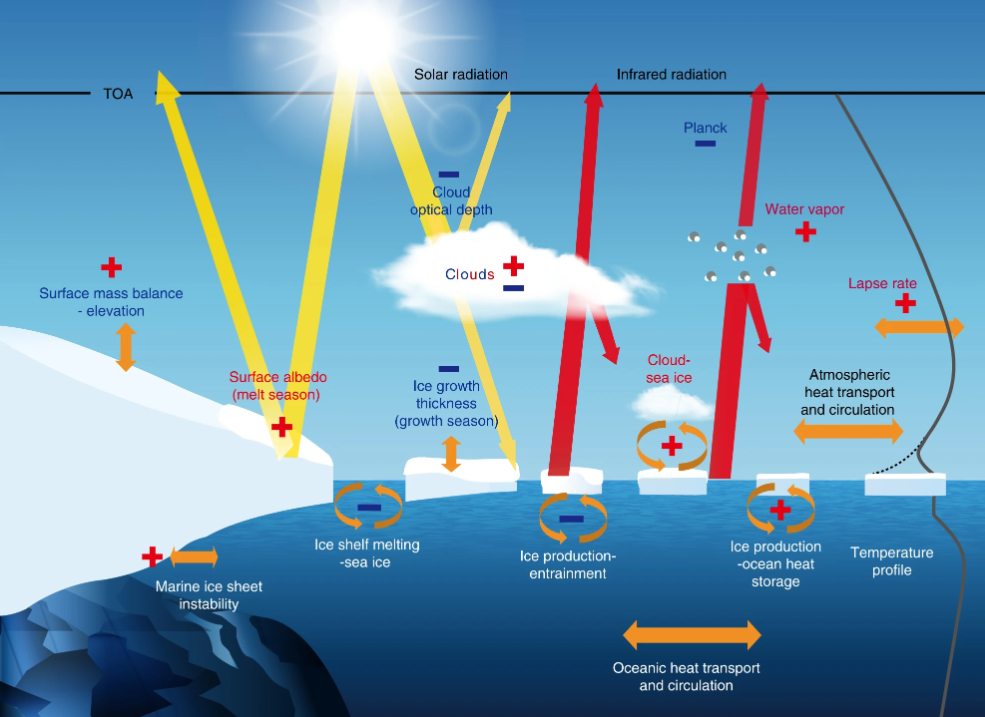
Figure 3: Illustration of significant radiative and non–radiative mechanisms in polar regions, encompassing interactions among the atmosphere, ocean, sea ice, and ice sheets that contribute to the surface energy balance.[9]
How is the Cryosphere Changing?
The cryosphere significantly impacts Earth’s climate due to its high surface reflectivity, known as albedo. This characteristic enables it to reflect a substantial portion of solar radiation back into space, dictating the amount of solar energy absorbed by both land and ocean. Ice and snow’s high albedo, helps regulate Earth’s temperature by cooling polar regions and reducing solar energy absorption. This contributes to Earth’s global temperature regulation known as dynamic equilibrium. The reduction in highly reflective snow and sea ice cover has resulted in the exposure of more low albedo surfaces. Consequently, these surfaces absorb more solar heat, contributing to increased warming within the region. This directly influences ice and snow on land, whether in the shape of ice sheets or glaciers, and serves a crucial function within the Earth system by storing immense quantities of water away from the oceans over extended periods.
A summary of this can be found in Figure 4. Any alteration in the volume of ice stored on land— whether through the growth or retreat of ice sheets and glaciers—directly influences the global average sea level. Ice and snow naturally undergo changes due to variations in Earth’s orbit, which gradually shift climate patterns over extended periods. However, human–induced factors such as greenhouse gas emissions accelerate the melting of ice and snow, disrupting these natural cycles. This acceleration leads to quicker reductions in ice cover and snowpack. As these frozen surfaces melt due to rising temperatures, their diminishing coverage contributes to further warming, ultimately amplifying climate change effects through a positive feedback loop[10]. Examples of this can be found over recent decades, the Greenland ice sheet (GrIS), recognised as the largest freshwater reserve in the northern hemisphere, has undergone intensified mass depletion due to atmospheric warming and the darkening of its surface. Moreover, the Ross Ice Shelf located in West Antarctica has also encountered increased occurrences of surface melting.[11] This phenomenon can lead to hydro-fracturing of ice shelves and facilitate further ice loss.
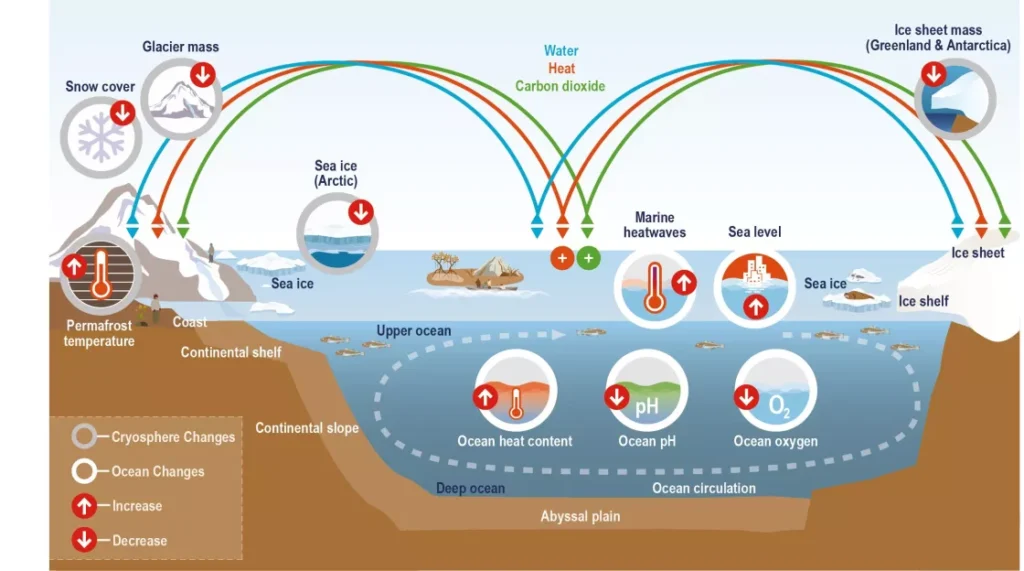
Figure 4: Illustration describing climate change–related effects of ice and snow in the cryosphere. Oceanic changes including sea level rise, increasing ocean heat and marine heat waves, ocean de-oxygenation, and ocean acidification. Changes in the cryosphere include the decline of Arctic sea ice extent, Antarctic and Greenland Ice Sheet mass loss, glacier mass loss, permafrost thaw, and decreasing snow cover extent.[12]
The study of the cryosphere through remote sensing stands as a vital aspect within modern environmental and earth sciences. The perpetual coverage of snow and ice on Earth, especially across expansive polar ice sheets like Greenland and Antarctica makes their surveillance pivotal in monitoring change. Ice sheets, glaciers and snow are highly responsive to temperature and precipitation changes, highlighting the importance of remote sensing methods in evaluating their dynamic features across different times and locations. Diverse data sources such as multi–spectral, hyper-spectral, thermal, and radar observations offer insights into these characteristics. The recent advancements in satellite technology have transformed the way we globally monitor the cryosphere through remote sensing techniques.
This is an example of how optical satellite imagery can be used to track environmental changes. The time-series[13] animation displays Envisat Advanced Synthetic Aperture Radar (ASAR) data from July 31, August 4, and August 7, 2010, showing the calving of the Petermann Glacier’s ice shelf in Greenland and the movement of the resulting iceberg. In 2010, the glacier’s ice shelf decreased by more than 4 times the size of Manhattan island. Ice shelves cause a phenomenon called “buttressing,” they act like a plug reducing glacier flow into the ocean from the parent-glacier. Major calving events like this can result in increased ice flow speed therefore land-ice meltwater run off into the ocean.
A second, smaller calving event of the Petermann ice shelf occurred in 2012. These events are becoming more frequent as sea and air temperatures continue to rise, reinforcing the need for accurate monitoring and analysis using Earth Observation and remote sensing techniques.
Video 2: A time-series gif from ENVISAT optical imagery of the Petermann Glacier Ice Shelf (PGIS), North West Greenland, during the 2010 major ice berg calving event.
Thermal Signatures of Ice and Snow
Understanding Signatures
The thermal emissivity of snow and ice is fundamental to the energy balance and interaction of the polar and cryosphere regions with the atmosphere. Emissivity is a measure of how efficiently a surface emits thermal radiation and is important because it influences how much thermal radiation a surface emits, which in turn affects its temperature, energy balance, and interactions with the surrounding environment. While snow and ice possess high albedo, reflecting a significant portion of incoming solar radiation back into the atmosphere, they also emit thermal radiation, influenced by their emissivity. In the thermal infrared spectrum, ice exhibits high absorption, resulting in snow behaving nearly like a blackbody, with an emissivity ranging from 98-99%. As wavelengths extend, their characteristics differ, enabling microwave emission to identify snowmelt on ice sheets and distinguish between sea ice and open water through remote sensing techniques. Typically, fresh snow, with its high porosity, displays low emissivity, while older, compacted snow and ice tend to exhibit higher emissivity values. Figure 5 shows how different types of snow and ice emissivity changes across the thermal infrared window[14].
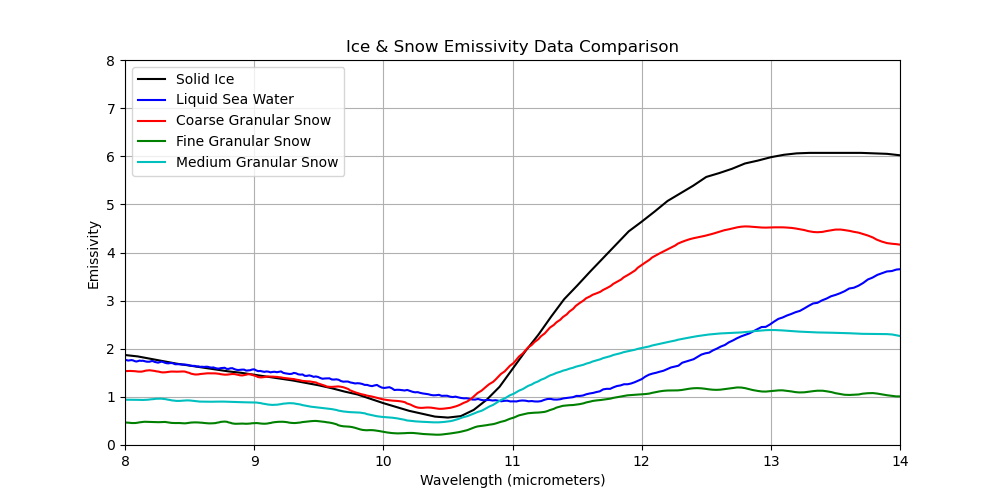
Figure 5: Emissivities from the ECOSTRESS data library, of solid ice, liquid sea water, coarse, fine and medium granular snow within the thermal infrared spectral region
Research[15] indicates that factors such as grain size (for snow), bubbles (for glacier ice and lake ice), brine inclusions (for sea ice) and surface roughness impact the emissivity of snow and ice . Variations in emissivity directly impact energy exchange processes, including radiation absorption and emission, consequently influencing surface temperature, snowmelt, and climate dynamics[16] . At a regional scale, the emissivity of snow pack holds significance in hydrological studies and the surface energy balance of snow. A comprehensive understanding of snow and ice emissivity is indispensable for precise climate modeling and evaluating the response of polar regions to climate change[17].
Capturing Signatures
The thermal signatures emitted by ice and snow offer profound insights into frozen landscapes and their intricate connections with weather and climate. These encompass a multitude of interactions, including glaciological processes like ice berg calving, surface mass balance, and freshwater discharge rates, as well as the physics of ice surfaces and their emissivity. Additionally, they involve the interplay of land and sea ice patterns in response to shifting temperatures, and their influence on atmospheric and oceanic circulations. The following applications provide examples of key research themes based upon thermal properties of ice and snow, and how satellite remote sensing is pivotal in providing robust and reliable data for analysis.
Capturing ice and snow thermal signatures can provide intricate analysis of three key dynamics:
- Surface temperature mapping
- Snow cover assessments
- Ice melt detection
While these signatures are fundamental to scientific research on ice and snow, it’s important to note that there exist other signatures beyond these that contribute to a comprehensive understanding of frozen environments.
Surface Temperature Mapping
Land–ice surface temperature (IST) theory in thermal remote sensing revolves around the principle that all objects emit thermal radiation based on their temperature. IST is the radiating or skin temperature of the ice surface, including any surface features such as supra–glacial lakes or melt ponds. For Earth’s typical surface temperatures the highest radiometric emission occurs within two infrared spectral windows: the mid-wave infrared (3.5–5µm) and the thermal infrared (8–13µm). Within these windows, the emitted radiation at specific wavelengths is determined by both temperature and emissivity.
Space–borne radiometers on satellites are used to measure land and ice surface temperatures within the thermal infrared part of the electromagnetic spectrum. They have been pivotal for collecting regular, consistent data due to their capability to capture measurements during both day and night, exhibiting reasonable accuracy. However, their effectiveness is limited when clouds obstruct the surface. Therefore, the precision of the data retrieval relies on cloud detection techniques and the capacity to distinguish clear surface areas uncontaminated by cloud cover.
Figure 6 demonstrates an IST retrieval from the polar orbiting Moderate Resolution Imaging Spectrora- diometer (MODIS) satellite. It serves as a key indicator of the energy balance occurring at the surface of the ice. It significantly influences the exchange of energy between the ice layer and the atmosphere and is classed as an essential climate variable (ECV) which critically characterises Earth’s climate. The surface temperatures of ice and snow are subject properties of the frozen surface itself.
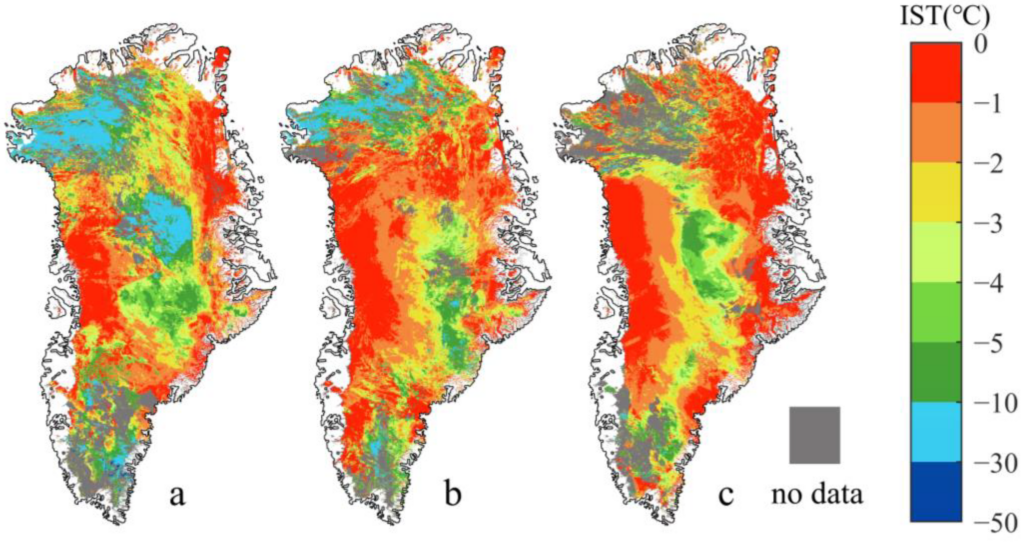
Figure 6: Ice surface temperature map of the Arctic circle retrieved from MODIS a) 11 July, b) 12 July, c) 13 July 2012. IST under cloud has is represented as no data.[18]
The reduction of highly reflective snow and ice cover has exposed more low albedo surfaces. Consequently, these surfaces absorb greater amounts of heat from the sun, thereby intensifying the warming of the region. The prevalent ice–covered areas in the Arctic are notably vulnerable to rising surface temperatures, particularly leading up to thawing points that trigger permafrost thaw, reduction of snow cover and sea ice, and the depletion of mass in glaciers and the Greenland ice sheet.
Thermal sensors capture these temperature variations, generating detailed maps that showcase temperature gradients across frozen landscapes. This mapping provides crucial, robust climate data for understanding regional climate variations, identifying hot spots of change, and monitoring trends over time. One example can be seen in Figure 7 that shows a twenty–year surface temperature trend for Greenland using the European Space Agency’s (ESA) Climate Change Initiative (CCI) dataset. This research highlights just one way of analysing thermal data from Space, that advances our understanding of ISTs and their changing trends.
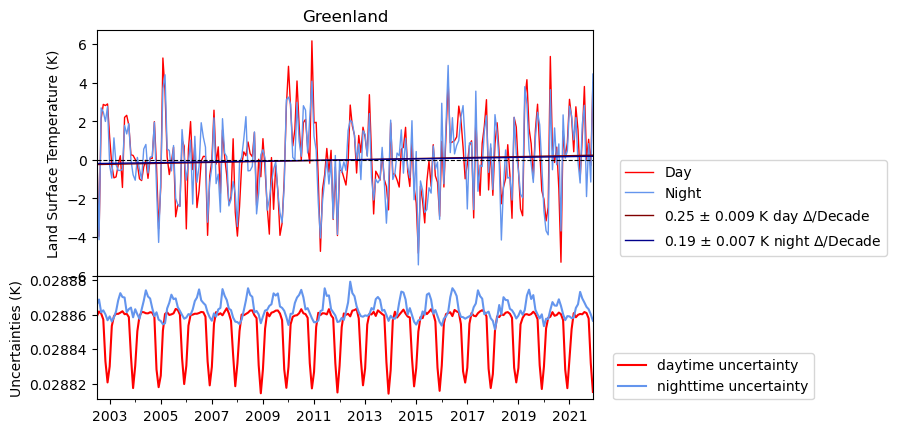
Figure 7: Day and night LST anomalies with gradient uncertainty, and accompanying propagated uncertainty budget for Greenland between 2002 and 2021 using robust European Space Agency climate data record.[19]
Snow Cover Assessments
Snow cover holds significance as an essential surface attribute impacting the allocation of surface radiation, energy, and hydrological resources. It comes in various types ranging from wet snow to dry snow and ice. Each showcasing distinct thermal properties attributed to their composition and density. Through thermal remote sensing, these differences in snow types are discerned via their unique thermal signatures, altering the radiation captured by sensors[20].
Satellite imaging has seen significant advancements in accurately measuring snow accumulation and cover, incorporating details like snow depth, snow water equivalent, and snow albedo[21]. This data is harnessed to generate snow cover maps of exceptional precision, surpassing the accuracy achieved through conventional methods like ground surveys or aerial photography. Data records of snow cover help to analyse the dynamics of Earth’s climate system and to improve and validate climate models. Figure 8 shows an example of snow cover extent from the Climate Forecast System Reanalysis (CFSR), which is a product intended to offer the most accurate estimation of the interconnected conditions of atmosphere-ocean-land surface throughout a specific time frame[22].
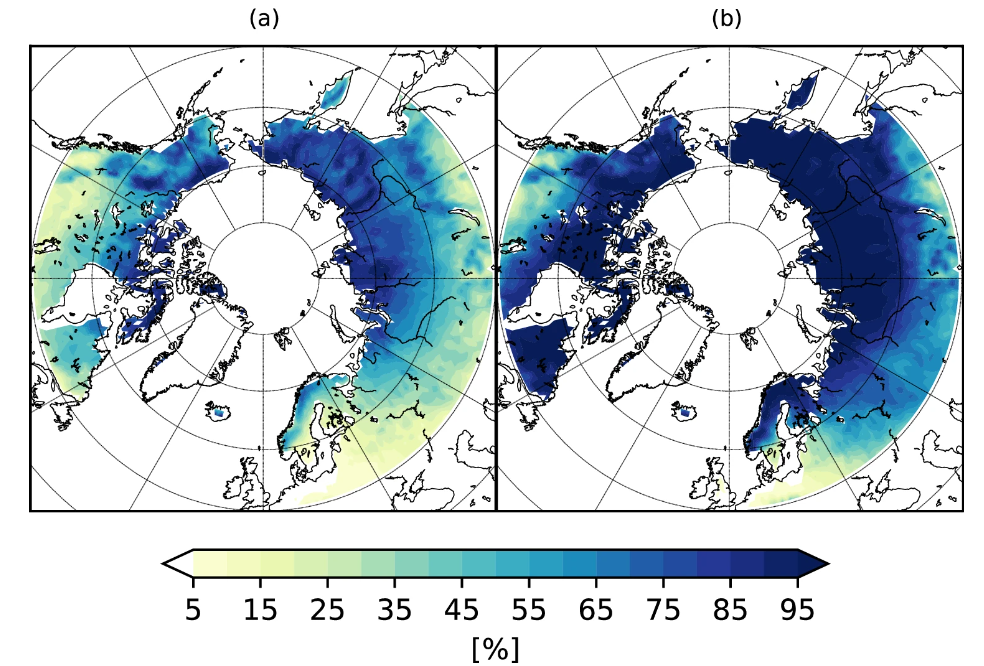
Figure 8: Climatology of snow cover extent in October–November (a) and March–April (b) from the NCEP/CFSR reanalysis over the period 1979–2005[23]
Whilst CMIP snow cover maps do not directly use thermal data such as LST, it can be complimentary since snow cover and surface temperatures are inherently linked[24]. Seasonal changes in both snow cover and surface temperatures allows for investigation into relationships and feedback’s which highlights the benefits of utilising thermal data with other remotely sensed datasets[25]. Delving into the thermal signatures of snow and ice allows researchers to conduct quantitative analyses, estimating crucial snow parameters like depth, density, and water content and their relationship with other variables such as snow cover, extent and water content[26].
Why is it important to analyse snow cover data?
- Climate & glaciological studies
- Snow cover data contributes to improving climate model in change predictions between climate and atmospheric dynamics and glaciers.
- Hydrology
- Snowmelt, freshwater discharge into the oceans, glacier recession rates and ice velocity. Mapping and monitoring thermal changes helps scientists to piece together trends of change, crucial for water resource management and hyrdological depletion.
- Natural hazard monitoring
- Assessment of avalanche and runoff risks to local and regional communities.
This wealth of information proves invaluable for applications in hydrological models, water resource management, and evaluating avalanche risks, especially in mountainous regions where accurate snow assessment is imperative. Moreover, given the sensitivity of polar regions to climate shifts and their potential repercussions on broader global changes, advanced analysis of thermal signatures within snow cover becomes increasingly critical.
Ice Melt Detection
Using thermal remote sensing can also be useful when detecting changes in ice and snow temperatures to monitor melt and assess extent. Over the large ice sheets of Greenland and Antarctica, melting is one of the drivers for mass losses, either through direct runoff or through the impact on ice dynamics.[27]
Surface snowmelt on ice sheets is a critical measure for accurately gauging surface material loss and changes in reflectivity. As snow and ice melt, they alter surface wetness, influencing how the ice sheet reflects radiation and affecting the entire region’s radiation balance. Moreover, when this meltwater seeps to the base of the ice layer, it acts as a lubricant, accelerating ice movement and disintegration. Through hydrofracturing, the meltwater destabilises ice shelves, impacting their mass balance and contributing to rising sea.[28]
Basal meltwater rates also influence mass loss from ice shelves. Roughly half of the mass loss from Antarctica’s floating ice shelves in a stable condition is attributed to basal melting driven by the ocean. Monitoring land and sea surface temperatures in relation to ice shelf discharge, calving and mass loss is crucial. Altimetry is a powerful tool used to measure ice sheet and sea ice thickness from Space and can be complimentary to thermal data. Figure 9 shows the spatial distribution of Antarctic Ice Shelf melt rates during 2010–2018 and shows melt differences between cold–and warm–water ice shelves in response to oceanic thermal forcing. This is just one example of how having access to remote sensing data can further our understanding of large–scale climate and ice dynamics.
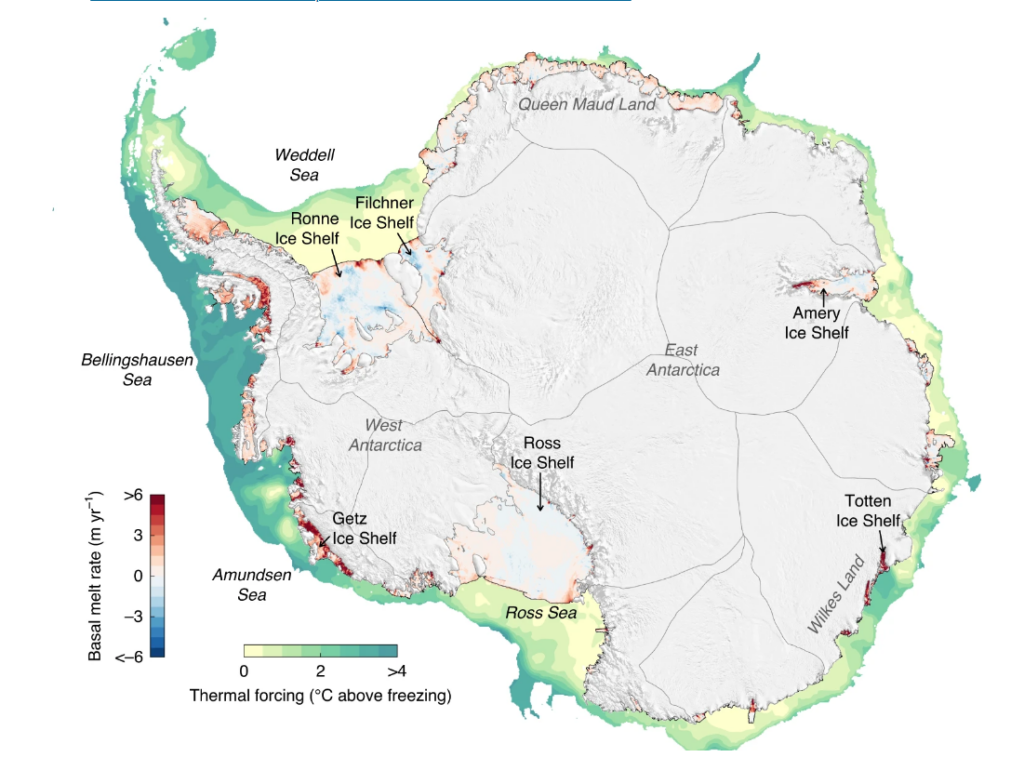
Figure 9: Basal melt rates of Antarctic Ice Shelves averaged between 2010-2018 using Cryosat-2 Altimetry with mapped thermal forcing[29]
Other analyses of thermal properties of ice melt is on the impact of sea ice extent and thickness. Melt ponds, open water pools that develop during summer on the surface of sea ice, hold a pivotal role in shaping the Arctic climate and the energy balance of sea ice. Rising air, surface and oceanic temperatures have been linked to increased melt ponds, which also contribute to inducing positive feedbacks such as reduced albedo and further warming[30].
Other recent research however, has been highlighting important changes to sea ice extent, particularly in the summer. The substantial decline in extent in the Arctic since 1979 is one of the strongest indicators of climate change. Figure 10, depicts a monthly average sea ice extent map for March and September 2020. During September 2020, the average monthly extent measured 3.92 million km2, marking the second lowest extent recorded in the 42-year satellite record. Many studies using thermal sea surface temperature data link reductions in summer sea ice to consistent rising temperatures. These are just some examples of how being able to access thermal data from Space allows for inter–comparison and advanced analysis of glacier, ice sheet and sea ice dynamics in relation to a changing climate.
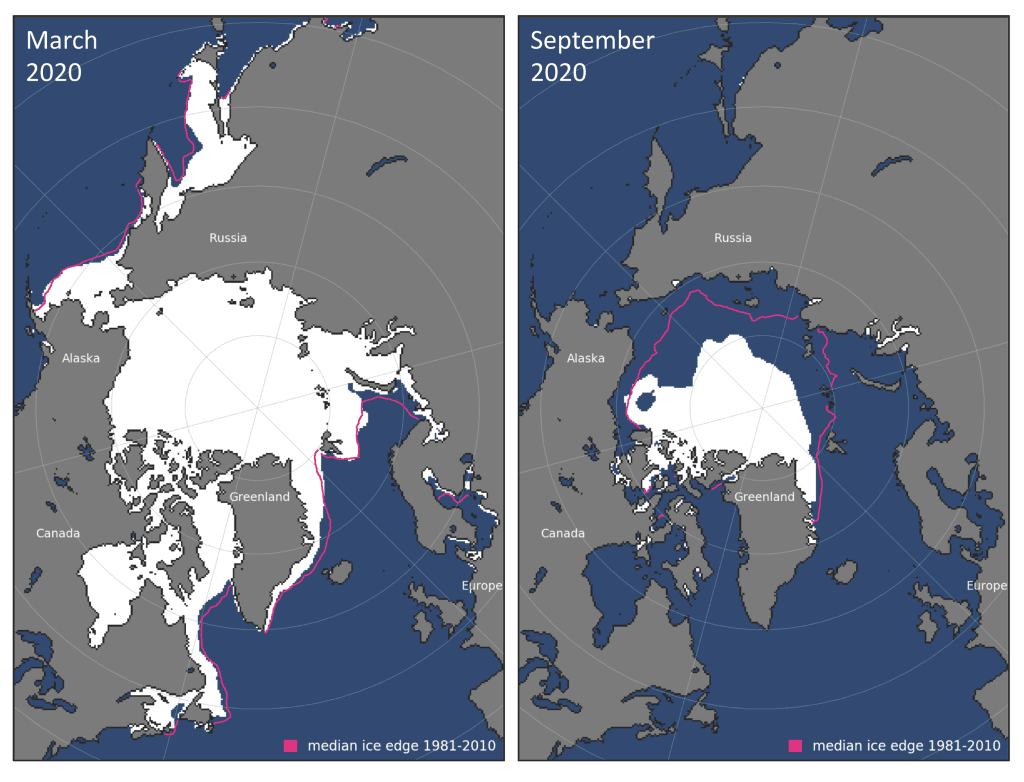
Figure 10: Monthly average sea ice extent map for (left) March 2020 and (right) September 2020.[31]
Data Availability
Satellites and Sensors
Table 1 gives a brief overview of the satellites and sensors that provide thermal data for the cryosphere and polar regions. Sensors may vary in spatial and temporal resolution, data record length, and studied location.
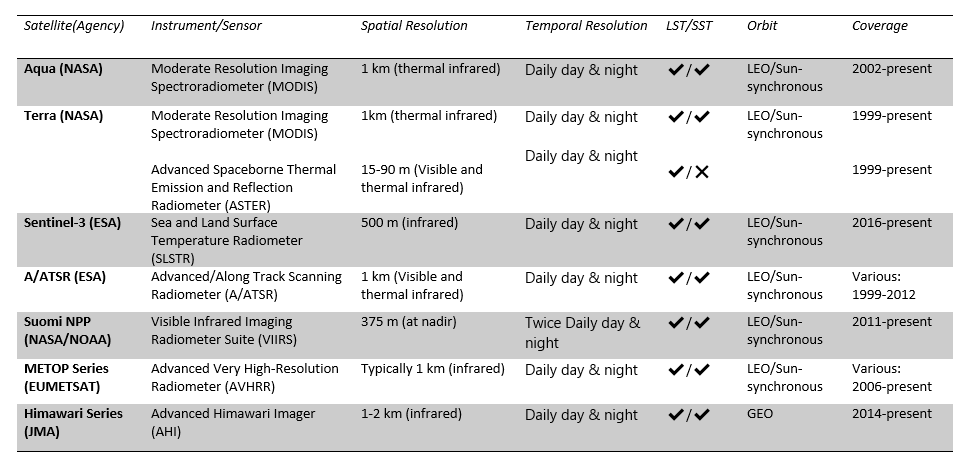
Table 1: Satellites and sensors currently available that collect thermal data
Other satellites and sensors also exist that provide different and/or complimentary data for ice and snow across Earth. Table 2 gives a short overview of the most commonly used remote sensing data platforms.
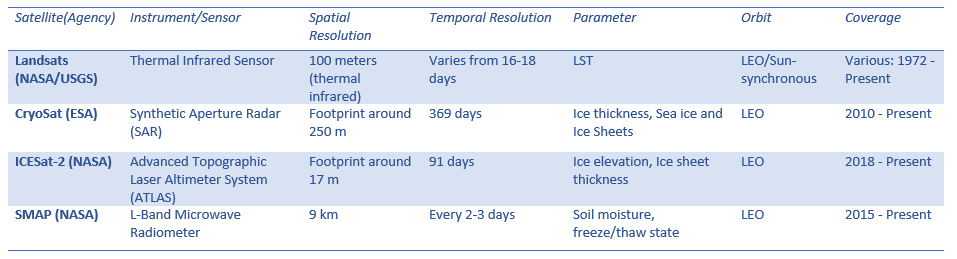
Table 2: Satellites and sensors currently available that collect ice and snow data
Data Products and Tools
It is important to be able to freely access satellite data and there are plenty of robust datasets available. This includes but not limited to products from the European Space Agency (ESA), The National Aeronautics and Space Administration (NASA), The European Organisation for the Exploitation of Meteorological Satellites (EUMETSAT), National Oceanic and Atmospheric Administration (NOAA) and the United States Geological Survey (USGS).
The following list describes some of the best and most commonly used open access data portals to access and analyse thermal data for free.
- ESA Open Data Portal: https://climate.esa.int/en/odp/#/dashboard
- ESA Earth Online – Copernicus Open Access Hub: https://earth.esa.int/eogateway
- NASA Earthdata: https://www.earthdata.nasa.gov/
- USGS Earth Explorer: https://earthexplorer.usgs.gov/
- NOAA Comprehensive Large Array-Data Stewardship System (CLASS):https://www.avl.class.noaa. gov/saa/products/welcome;jsessionid=89CB20B53C20144D32B808CA6D3218BF
- EUMETSAT Earth Observation Portal: https://eoportal.eumetsat.int/cas/login
Other graphical user interfaces, data portals and products exist that allow access to other ancillary and compli- mentary ice and snow, climate and weather data, for the cryosphere and for specific regions such as the Arctic and Antarctic.
- Copernicus Climate Change Service: https://cds.climate.copernicus.eu/cdsapp#!/dataset/reanalysis-era5- tab=form
- Provides access to climate data, including the ERA5 reanalysis dataset, supplying extensive details on a range of climate factors like temperature, precipitation, wind, and additional parameters.
- Climate Explorer: https://climexp.knmi.nl/selectstation.cgi?id=someone@somewhere
- Users can utilise this platform to access and analyse climate data from diverse sources, facilitating exploration and visualisation of location or region-specific climate-related information.
- Greenland Climate Network: https://cires1.colorado.edu/steffen/gcnet/
- This initiative gathers and disseminates climate data, with a specific focus on Greenland, providing valuable insights into the area’s climate patterns, encompassing temperature, precipitation, and other pertinent environmental elements.
- NOAA Physical Sciences Laboratory https://psl.noaa.gov/data/index.html
- It grants access to an extensive array of physical science data, encompassing atmospheric, oceanic, and environmental datasets critical for conducting research and analysis in climate science and its associated disciplines.
- IRI Climate Data Library https://iridl.ldeo.columbia.edu/
- The library provides a varied assortment of climate data, tools, and resources dedicated to research and analysis, with a particular emphasis on meteorological and climate-related datasets.
National Snow and Ice Data Centre ITS LIVE https://nsidc.org/apps/itslive/
- This resource is dedicated to offering information and tools specifically tailored for studying alter- ations in snow and ice cover. It proves particularly beneficial for monitoring and comprehending global cryospheric shifts.
- PROMICE https://promice.org/
- It stands for Programme for Monitoring of the Greenland Ice Sheet. It’s a network that monitors the ice sheet, providing data and insights into changes in Greenland’s ice mass and related climatic conditions.
- Google Earth Engine Digitising Tool (GEEDiT) https://liverpoolgee.wordpress.com/geedit-geedit-reviewer/
- This tool available in GEEDiT of geographic features, enabling users to generate, modify, and evaluate geographic data for diverse applications such as ice extent, including environmental and climate research.
Current Impact and Future Direction
Thermal remote sensing has transformed how we grasp the cryosphere, offering crucial insights and driving significant changes in scientific research and environmental management. By consistently observing glacier temperatures, it unveils the complex behaviours of these ice masses, predicting their movements and assessing their impact on rising sea levels. Analysing ice sheet mass balance helps us understand stability and potential sea level effects. Mapping permafrost temperatures provides insights into degradation risks and greenhouse gas emissions. This technology monitors sea ice, improving climate models and aiding disaster response. Such data informs policy decisions and adaptation strategies, recognising the cryosphere’s influence on ecosystems and communities.
Whilst not specific to the cryosphere, remote sensing of the environment has created impact through global treaties that aim to mitigate climate change which includes, the Montreal Protocol (1987), the Kyoto Protocol (1997) and the Paris Agreement(2015). Studies focusing on the cryosphere have played a vital role in shaping several significant climate policies and treaties designed to tackle environmental challenges. Examples of these are the Arctic Council agreements, the Antarctic Treaty System and the Svalbard Treaty.
Research has helped influence and shape discussion, awareness and mitigation of climate change, especially in the most vulnerable regions covered in ice and snow. As satellite technology advances and scientific knowledge develops, it remains imperative for our future that research in thermal remote sensing of ice and snow continues to drive change. Understanding these dynamics is essential for precise climate models, allowing proactive steps to mitigate the widespread effects of cryospheric changes on global sea levels, regional climates, and vulnerable ecosystems. This research is vital for shaping adaptive strategies and policy choices necessary for a sustainable and resilient future amid persistent climate challenges.
References:
- [1] ESA Sentinel-1 project http://www.esa.int/Our_Activities/Observing_the_Earth/Copernicus/Sentinel-1
- [2] Lee, H., Calvin, K., Dasgupta, D., Krinner, G., Mukherji, A., Thorne, P., Trisos, C., Romero, J., Aldunce, P., Barret, K. and Blanco, G., 2023. IPCC, 2023: Climate Change 2023: Synthesis Report, Summary for Policymakers. Contribution of Working Groups I, II and III to the Sixth Assessment Report of the Intergovernmental Panel on Climate Change [Core Writing Team, H. Lee and J. Romero (eds.)]. IPCC, Geneva, Switzerland.
- [3] NASA (2004) A Tour of the Cryosphere, YouTube. Available at: https://www.youtube.com/watch?v=_WUpjXHo-O4 (Accessed: 01 October 2024).
- [4] Hall, D., 2012. Remote sensing of ice and snow. Springer Science & Business Media.
- [5] Glynn C. Hulley et al. “Land Surface Temperature”. In: Taking the Temperature of the Earth. 2019, pp. 57–127. isbn: 9780128144589. doi: 10.1016/b978-0-12-814458-9.00003-4.
- [6] European Space Agency. Colour vision for Copernicus. Web Page. n.d. url: https://www.esa.int/ About_Us/Ministerial_Council_2016/Earth_Observation_Programmes.
- [7] W Gareth Rees. Remote sensing of snow and ice. CRC press, 2005.
- [8] Copernicus ECMWF. The cryosphere in a changing climate. Web Page. n.d. url: https://climate. copernicus.eu/climate- indicators/cryosphere#:~:text=The%20cryosphere%20exerts%20an% 20important,absorbed%20by%20land%20and%20oceans..
- [9] Hugues Goosse et al. “Quantifying climate feedbacks in polar regions”. en. In: Nat. Commun. 9.1 (May 2018).
- [10] Huai, B., van den Broeke, M.R. and Reijmer, C.H., 2020. Long-term surface energy balance of the western Greenland Ice Sheet and the role of large-scale circulation variability. The Cryosphere, 14(11), pp.4181-4199.
- [11] Zou, X., Bromwich, D.H., Montenegro, A., Wang, S.H. and Bai, L., 2021. Major surface melting over the Ross Ice Shelf part II: Surface energy balance. Quarterly Journal of the Royal Meteorological Society, 147(738), pp.2895-2916.
- [12] National Snow et al. Why the cryosphere matters.Web Page. n.d. url: https://nsidc.org/learn/whatcryosphere/ why-cryosphere-matters
- [13] ESA (no date) Iceberg breaking off Petermann Glacier in Greenland, ESA. Available at: https://www.esa.int/ESA_Multimedia/Images/2010/08/Iceberg_breaking_off_Petermann_glacier_in_Greenland2 (Accessed: 03 October 2024).
- [14] S. K. Meerdink et al. The ECOSTRESS spectral library version 1.0. Remote Sensing of Environment. 230(111196), 1–8. 2019.
- [15] Warren, S.G., 2019. Optical properties of ice and snow. Philosophical Transactions of the Royal Society A, 377(2146), p.20180161.
- [16] Salisbury, J.W., D’Aria, D.M. and Wald, A., 1994. Measurements of thermal infrared spectral reflectance of frost, snow, and ice. Journal of Geophysical Research: Solid Earth, 99(B12), pp.24235-24240.
- [17] Jie Cheng et al. “Comparison of radiative transfer models for simulating snow surface thermal infrared emissivity”. In: IEEE Journal of Selected Topics in Applied Earth Observations and Remote Sensing 3.3 (2010), pp. 323–336.
- [18] Xiaoge Yu et al. “Assessment of MODIS Surface Temperature Products of Greenland Ice Sheet Using In-Situ Measurements”. In: Land 11.5 (2022), p. 593.
- [19] Abigail MarieWaring et al. “Regional climate trend analyses for Aqua MODIS land surface temperatures”. In: International Journal of Remote Sensing 44.16 (2023), pp. 4989–5032.
- [20] Masahiro Hori et al. “Dependence of thermal infrared emissive behaviors of snow cover on the surface snow type”. In: Bulletin of Glaciological Research 32 (2014), pp. 33–45.
- [21] Donald Perovich et al. “Arctic report card 2020: Sea ice”. In: (2020).
- [22] NCAR Climate Data Guide. Climate Forecast System Reanalysis (CFSR). Web Page. n.d. url: https: //climatedataguide.ucar.edu/climate-data/climate-forecast-system-reanalysis-cfsr
- [23] Mar´ıa Santolaria-Ot´ın et al. “Evaluation of snow cover and snow water equivalent in the continental Arctic in CMIP5 models”. In: Climate Dynamics 55.11-12 (2020), pp. 2993–3016.
- [24] NASA. Snow Cover & Land Surface Temperature. Web Page. n.d. url: https://earthobservatory. nasa.gov/global-maps/MOD10C1_M_SNOW/MOD_LSTD_M.
- [25] Tingjun Zhang. “Influence of the seasonal snow cover on the ground thermal regime: An overview”. In: Reviews of Geophysics 43.4 (2005).
- [26] Cezar Kongoli et al. “15 Snow Cover Monitoring”. In: Remote sensing of drought: innovative monitoring approaches (2012), p. 359.
- [27] Marco Tedesco et al. “Remote sensing of melting snow and ice”. In: Remote Sensing of the Cryosphere (2015), pp. 99–122.
- [28] Dong Liang et al. “Time-series snowmelt detection over the Antarctic using Sentinel-1 SAR images on Google Earth Engine”. In: Remote Sensing of Environment 256 (2021), p. 112318.
- [29] Susheel Adusumilli et al. “Interannual variations in meltwater input to the Southern Ocean from Antarctic ice shelves”. In: Nature geoscience 13.9 (2020), pp. 616–620.
- [30] Sara Apar´ıcio. “Earth observations of Melt Ponds on Sea Ice”. In: The Cryosphere Discussions 2023 (2023), pp. 1–65.
- [31] Donald Perovich et al. “Arctic report card 2020: Sea ice”. In: (2020).